The US is at a pivotal point in its history. Gita Gopinath, the IMF's deputy managing director, recently urged Washington to take decisive action to reduce its debt, warning that the temptation to finance all spending through borrowing is a path that countries should avoid.
She argued that the US economy is strong enough for some fiscal consolidation. Personally, that sounds a bit painful during a cost of living crisis.
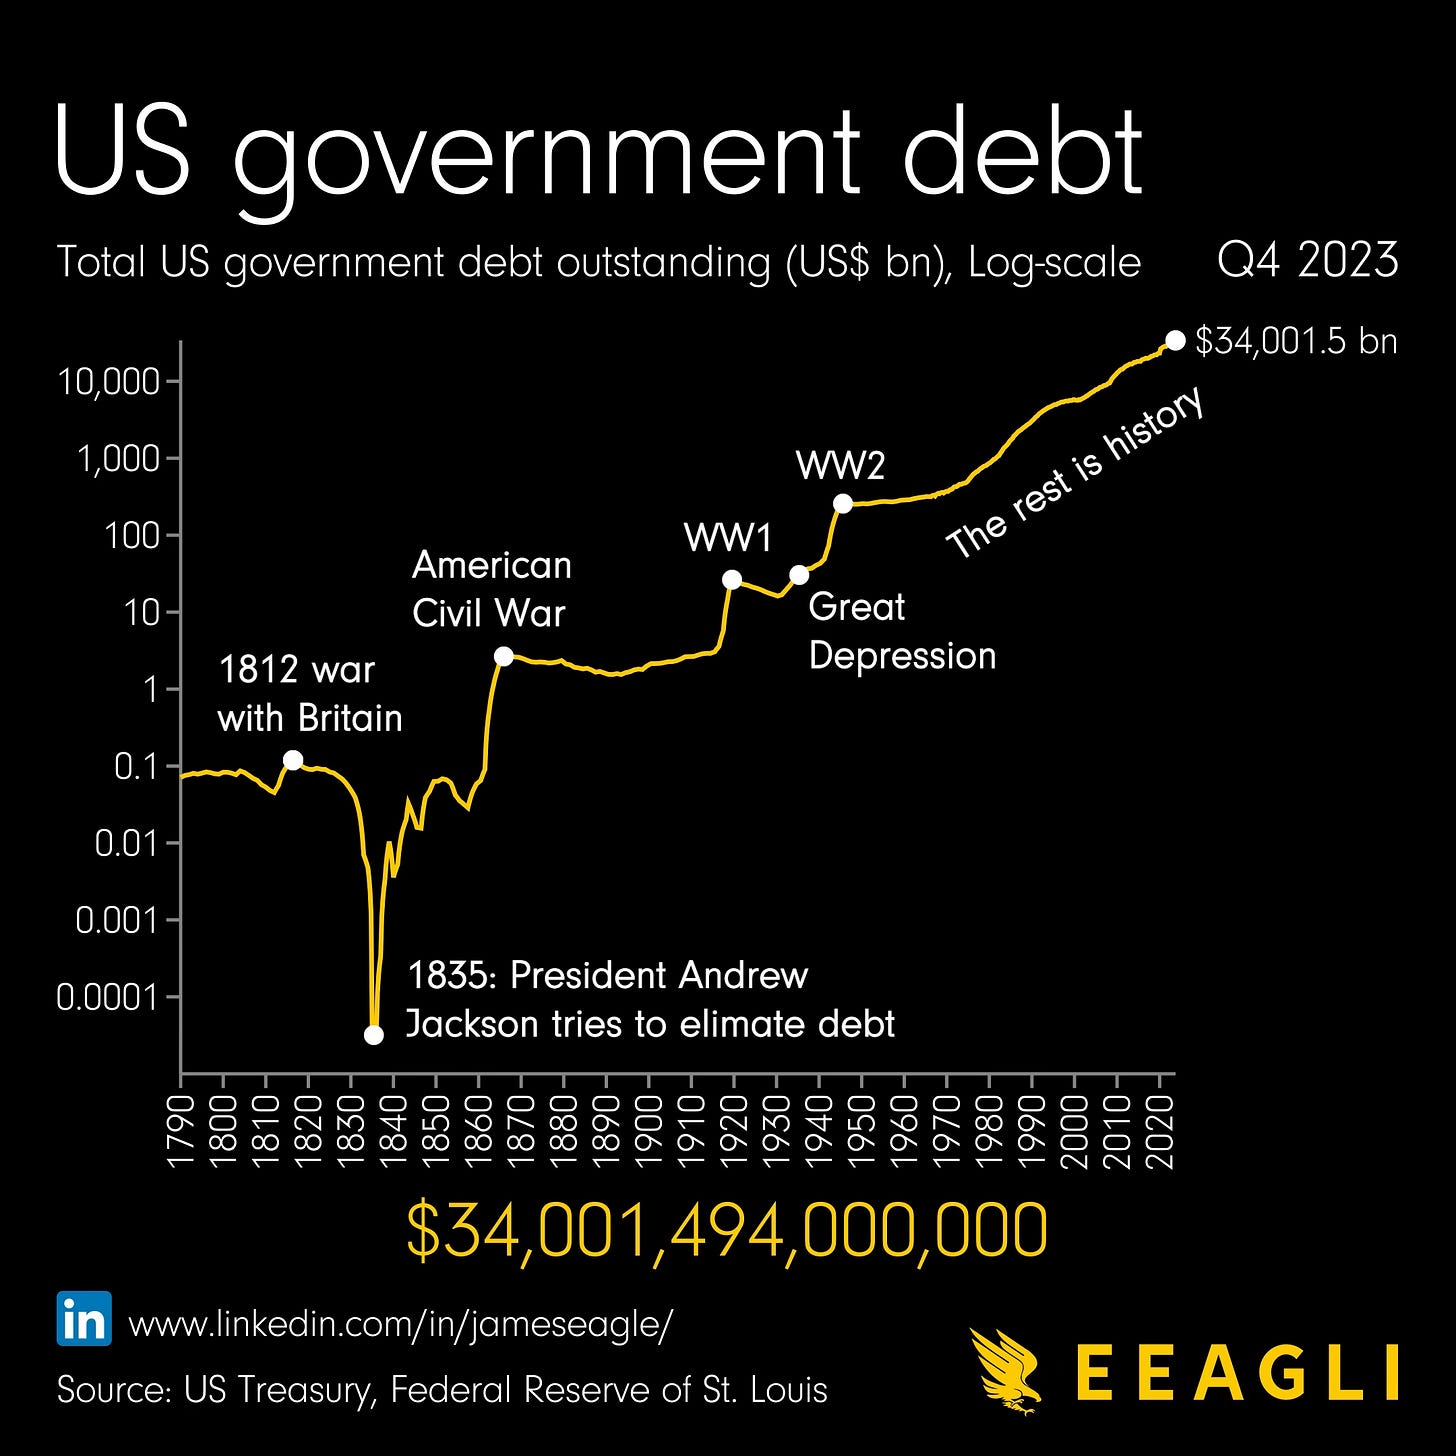
So, where do we stand? The US Treasury Market, the world's largest and most liquid government bond market, has grown to a staggering $34 trillion. This figure is so immense that it rivals the combined economies of China, Japan, Germany, India and the UK.
The reason the US Treasury market has been allowed to grow so large is because it is widely considered a trusted safe haven asset, which is why it is commonly held as a reserve asset by central banks. Some economists argue that despite the size of the US Treasury Market, it can still absorb plenty of demand for its issuances because there are few alternatives to US Treasuries.
However, China's attempt to diversify away from the US dollar into gold is a clear signal that even the world's second-largest economy is nervous, either because of trade wars or geopolitical tensions.
The US government may need to act now to address this growing debt pile. Interest payments on the debt alone have become one of the fastest-growing federal expenditures, predicted to surpass military and welfare costs by 2050. For the first time in history, the interest expense on US government bonds has risen to over $1 trillion, a pivotal and alarming milestone.
Moreover, the risk of a major global war in the near future could cause this debt pile to explode even further. If such a conflict were to occur, it could tip the scales against the US dollar, exacerbating the current situation. So take a look at this data visualisation or a brief history of how the US got to this enormous figure.
Source: Eeagli
Of course, the question here is whether or not the US can service this trillion-dollar interest expense?
Immediately after publishing this chart, I was hit by a barrage of calls to do GDP-to-debt. Some claimed it was better without giving a reason why. I suspect they don’t know. Others told me the data visualisation I published was misleading and sensationalist. It wasn’t. People get very touchy when it comes to data.
Well, I did do this debt-to-GDP data visualisation a couple of years ago, but people have clearly forgotten.
Source: Eeagli
There is a reason why I didn’t repost or update this chart. I don’t really like it. For those who don’t know, the reason why economists like the debt-to-GDP ratio is because, logically, it indicates whether or not government debt is covered by the output of the US economy.
The logic here is a bit like how credit analysts use an earnings multiple (EBITDA-to-debt) to see if a credit issuer can cover interest payments, or how banks often ask borrowers to produce payslips for the same reason.
However, it is not US economic output that makes US Treasuries creditworthy, but rather the ability to buy, hold and trade these securities in the most liquid bond market in the world that makes them attractive. US Treasuries, for now, act as a great store of value and medium of exchange for central banks, pension funds, and insurance companies around the world.
But that can change if the global economy and global trade fragment. There is a real risk that this might happen, and I believe economists are far too complacent about this risk. This is the real credit risk that the US government faces. And this could happen if there is a major conflict, which disrupts global trade significantly, damages foreign direct investment in the US and leads to a significant decline in demand for US dollars.
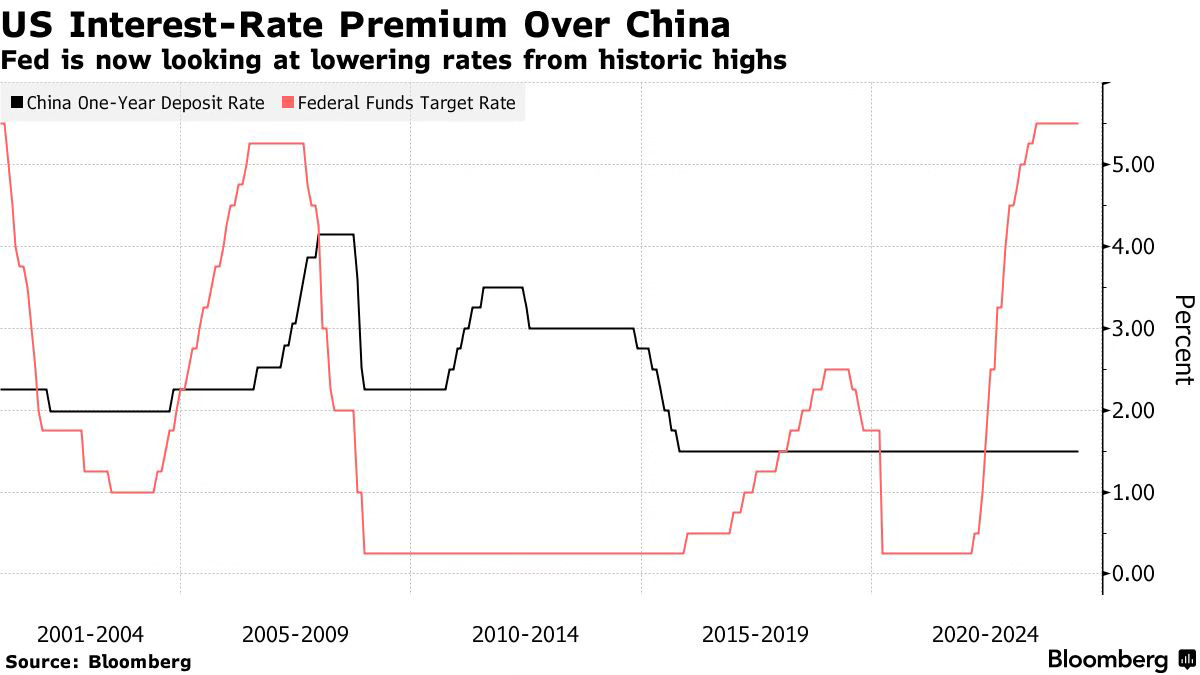
That’s not happening right now partly because there is actually too much demand for US dollars. There is actually a shortage of dollars. Take a look at this chart from Bloomberg:
Source: Bloomberg
There is a huge spread right now between the Fed Funds Target Rate and China’s one-year deposit rate. Why buy Chinese debt that’s backed by an unpredictable, non-free market economy when you can invest in US Treasuries with more yield, transparency, liquidity, etc.?
Ironically, it seems like the higher interest rate environment is actually allowing the US to print more money and borrow more.
Right! Sorry! I was suppose to post one chart here, not three. I got carried away. But I have four more great charts.
Coming up:
US government spending to rise to 44 per cent of the economy
China's bond market is attracting unprecedented levels of demand
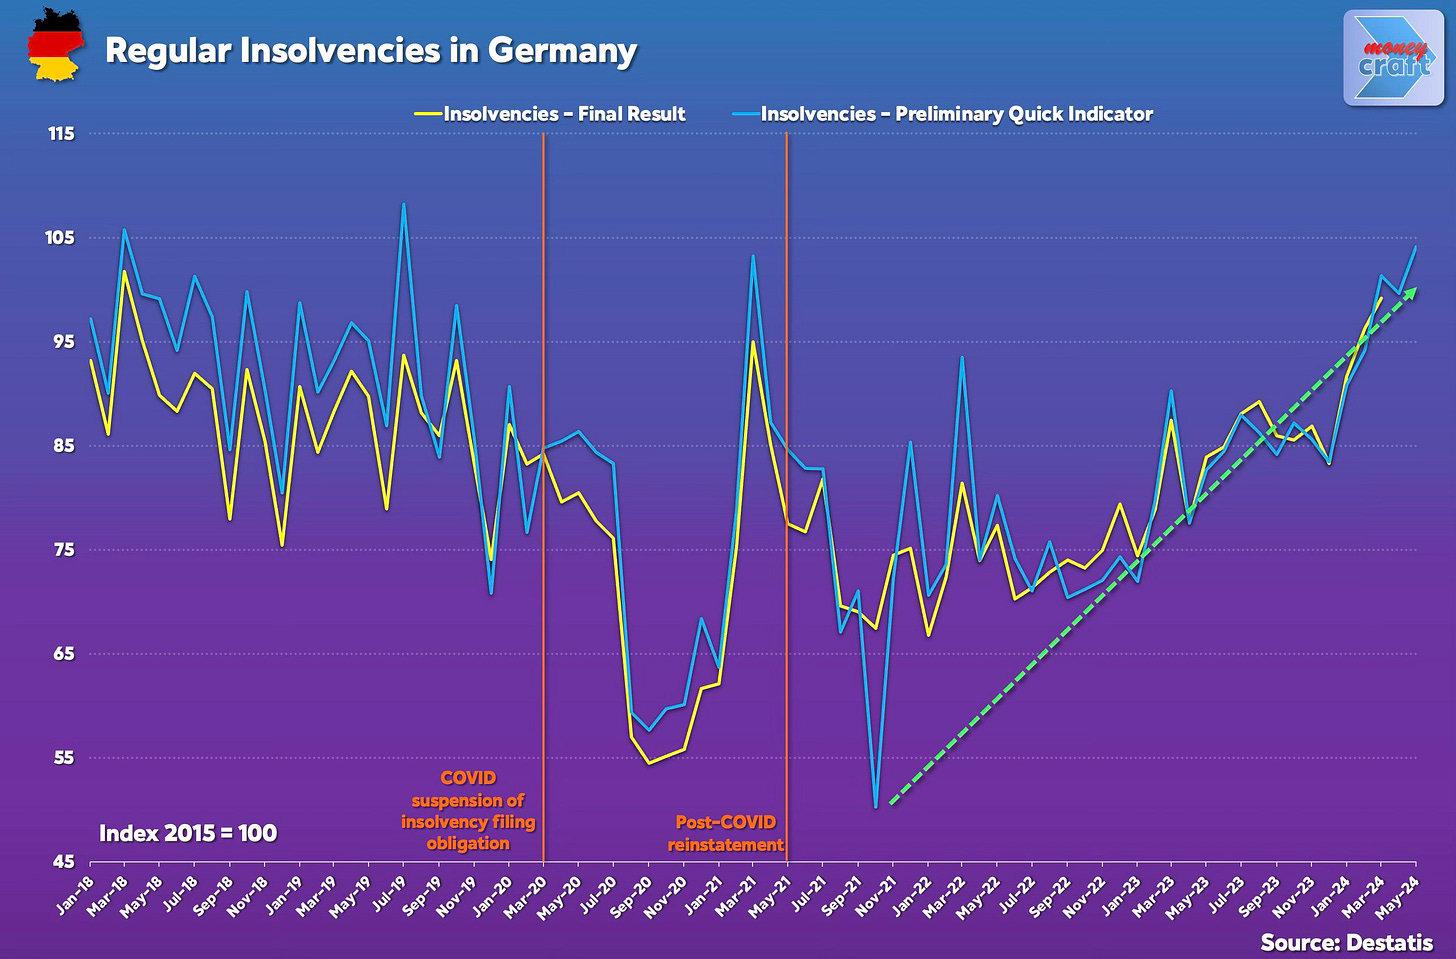
Insolvencies are on the rise in German
Hours of daylight in the Northern Hemisphere
If you like the sound of that line up, this is usually a paid newsletter. You basically get all my best ideas daily. Hit the subscribe button if you are interested and this will be sent to your inbox daily.
US government spending to rise to 44 per cent of the economy
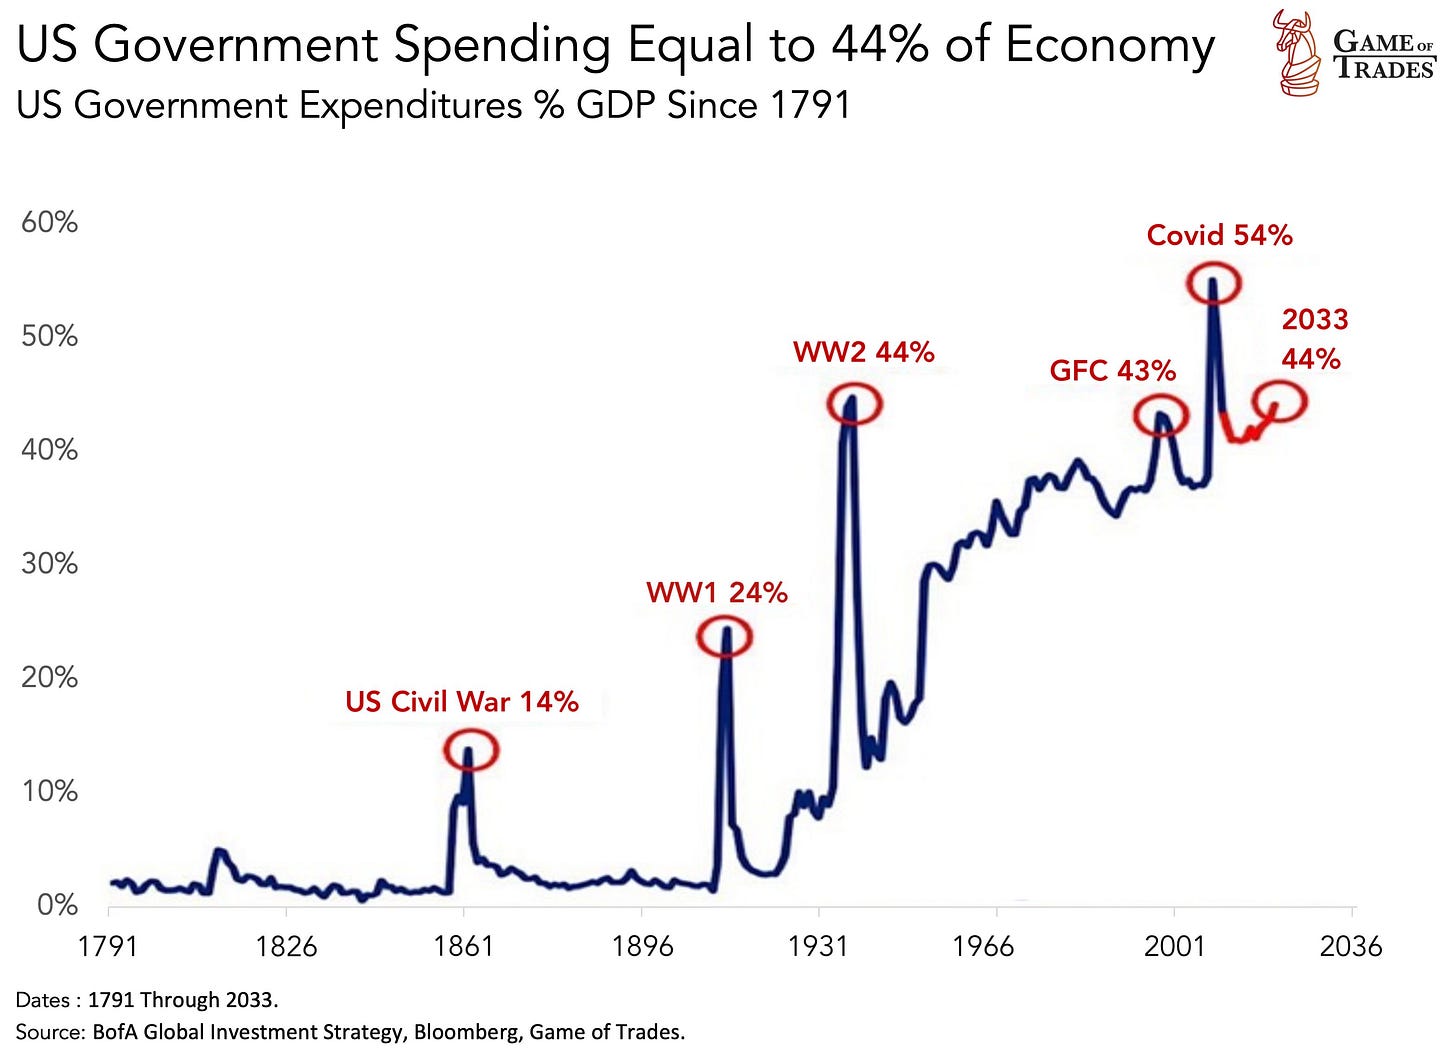
Just to follow on from the first chart, US government spending is on track to consume a staggering 44 per cent of the economy by 2033. I think that is a better metric than a debt-to-GDP ratio, which I’ve already complained about.
Anyway, this alarming figure, last seen during the tumultuous years of World War II, paints a grim picture of the country's fiscal future and raises serious questions about the sustainability of the current economic trajectory.
What we could see as a consequence of the story this chart tells are higher taxes, reduced public services and a diminished quality of life, which may threaten to erode the very foundation of the American Dream.
Source: Game of Trades
China's bond market is attracting unprecedented levels of demand
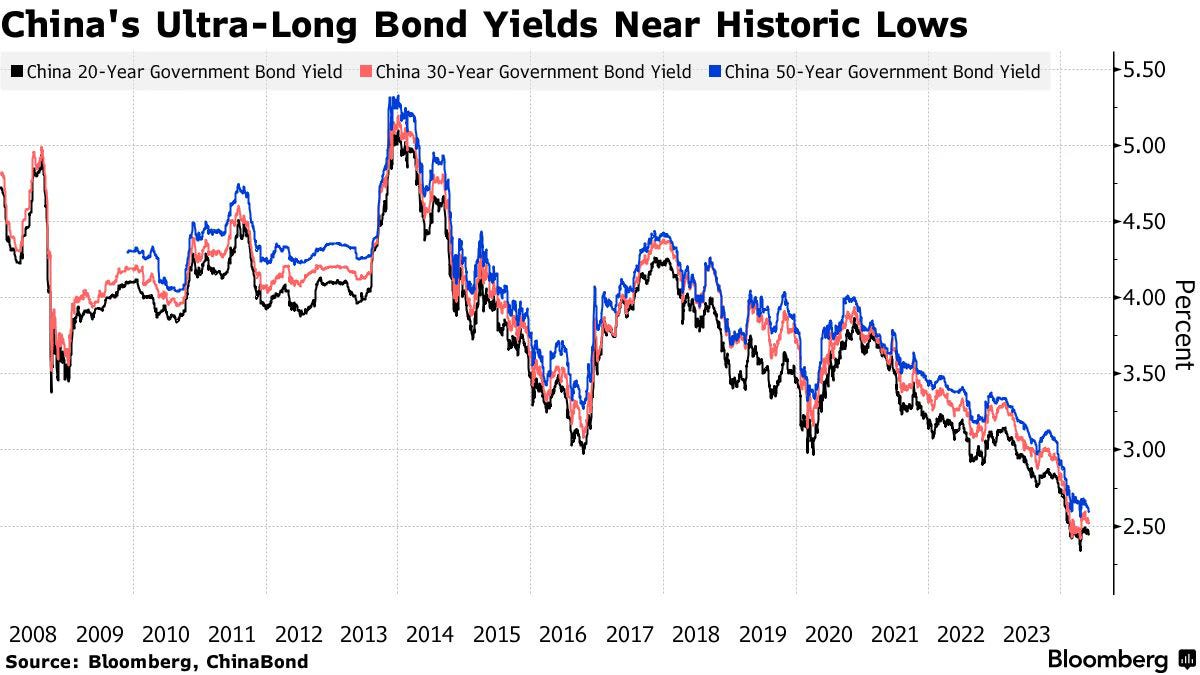
Right let’s switch to China. Its bond market is attracting unprecedented levels of demand from investors worldwide, even if this is still dwarfed by the demand for US Treasuries.
The allure on Chinese government bonds right now apparently lies in their relatively higher yields compared to other major economies (albeit not the US). China has also introduced measures to liberalise its bond market, removing ownership limits and quota systems that previously restricted foreign access.
The recent auction of 50-year special government notes has proved success. They achieved a record-low yield of 2.53 per cent and received an astounding five times the demand than what was on offer. This overwhelming response is particularly noteworthy given the warnings from authorities about the potential risks of a bond bubble, especially in longer-dated securities. Corporate bonds in China have also witnessed falling yields, with the yield gap between three-year AAA-rated credit bonds and sovereign notes approaching the record low set in 2022.
Source: Bloomberg
Insolvencies are on the rise in German
In Germany, insolvency filings are continuing to rise sharply. Preliminary data for May shows corporate insolvencies increased by 25.9 per cent compared to the same time last year. Final data for April also reveals a 28.5 per cent year-on-year rise in corporate insolvencies.
In the first quarter of 2024, there were 5,209 corporate insolvency filings, a 26.5 per cent increase from the first quarter of 2023 and an 11.2 per cent rise compared to the first quarter of 2020. Creditor claims soared to €11.3 billion, 69 per cent more than in the same period in 2023.
As Germany faces this surge in insolvencies, the wider European and global economies are also impacted. Policymakers and business leaders in Germany must find a balance between supporting struggling industries and maintaining fiscal discipline to address these challenges. Innovative solutions and bold reforms are needed to help Germany navigate this economic storm and emerge stronger
Source: Nikolay Kolarov
Hours of daylight in the Northern Hemisphere
Switzerland finds itself grappling with an unexpectedly gloomy start to the summer season. The usual postcard-perfect landscapes have been replaced by a seemingly endless barrage of rain. Yet, amidst the dreary weather, there is a glimmer of hope on the horizon – the longest day of the year. It is the pinnacle of the summer solstice and it is fast approaching.
In the meantime, as that data approaches, Climatologist Brian Brettschneider, known on Twitter as @Climatologist49, has created this captivating data visualisation. I think it is brilliant. I could watch it for hours.
Source: Brian Brettschneider


